By Alexander Almgren
Spotify Artist Statistics 2026: What 214,451 Tracked Artists Actually Look Like
Every week somebody sends me a screenshot of their Spotify for Artists page and asks the same question in slightly different words. Is this good. Is 4,000 monthly listeners good. Is 40,000 good. I've been answering from feel for years, and feel is a bad instrument, so I finally ran the question against the database I built for finding artists to work with. It holds 214,451 artists and 2,561,951 readings of their Spotify numbers, taken between January 2025 and September 2026. 102,184 of those artists have thirteen or more readings across a median of 336 days, which is what lets me say not just where people sit, but where they went.
Two honest caveats before the numbers, because I'd rather you trust them. This is not all of Spotify. It's artists that show up on Chartmetric with at least one public way to reach them, which means it skews away from the bottom of the market, the bedroom uploads with eleven listeners. And monthly listeners is a twitchy number. It moves with release cycles and playlist placements, so a six-month window catches people between records as well as on them. I kept the windows wide and the samples big for that reason.
Where Artists Actually Sit
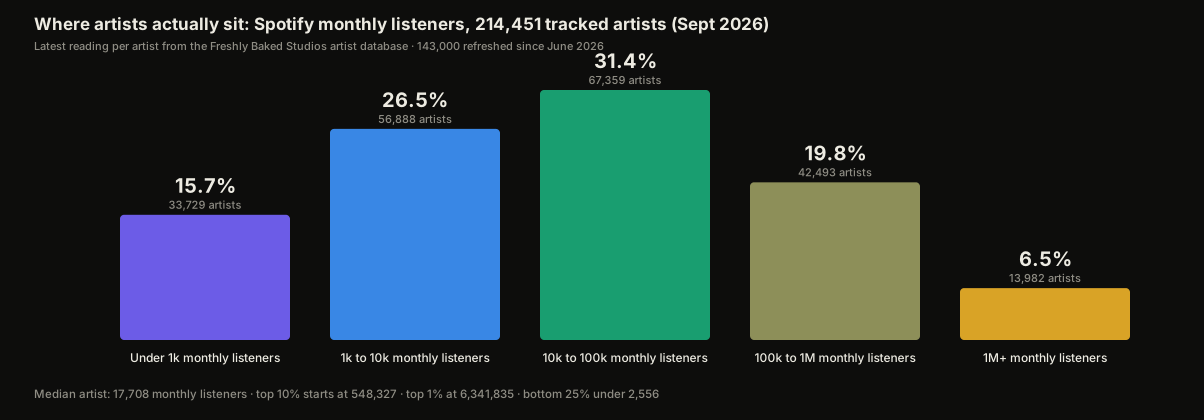
The median artist in my database has 17,708 monthly listeners. A quarter of artists sit under 2,556. The top 10% starts at 548,327 and the top 1% starts at 6.3 million.
| Monthly listeners | Artists | Share |
|---|---|---|
| Under 1,000 | 33,729 | 15.7% |
| 1,000 to 10,000 | 56,888 | 26.5% |
| 10,000 to 100,000 | 67,359 | 31.4% |
| 100,000 to 1 million | 42,493 | 19.8% |
| Over 1 million | 13,982 | 6.5% |
So when someone asks me whether 10,000 is good: it puts you above about 42% of the artists I track. 100,000 puts you above about 74%. That's the whole answer to the screenshot question, and it's the least interesting thing in the data.
Six Months Later
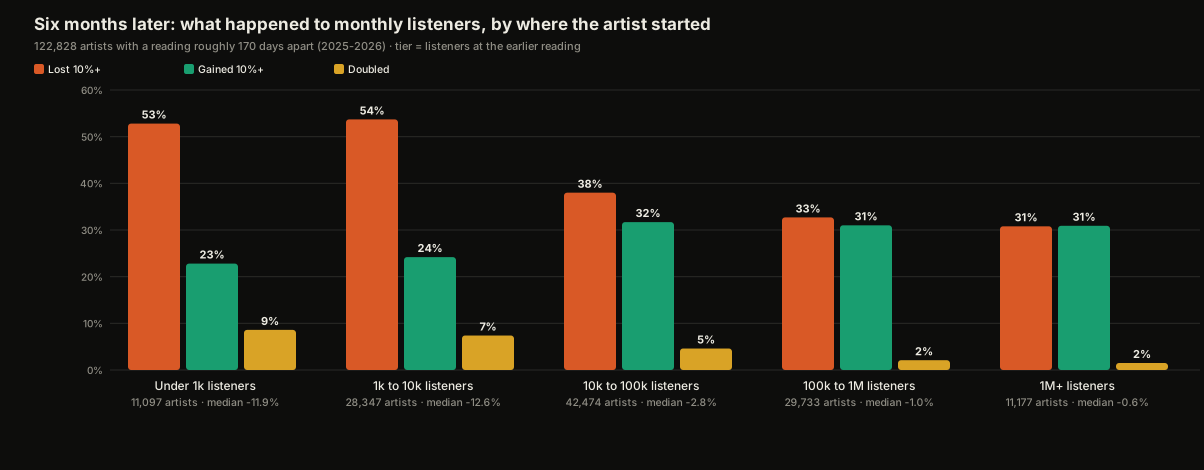
This is the chart I actually wanted. Take every artist with two readings roughly 170 days apart, 122,828 of them, sort them by where they started, and ask what happened.
| Started at | Artists | Lost 10%+ | Gained 10%+ | Doubled | Median change |
|---|---|---|---|---|---|
| Under 1,000 | 11,097 | 52.8% | 22.8% | 8.6% | −11.9% |
| 1,000 to 10,000 | 28,347 | 53.7% | 24.2% | 7.4% | −12.6% |
| 10,000 to 100,000 | 42,474 | 38.0% | 31.7% | 4.6% | −2.8% |
| 100,000 to 1 million | 29,733 | 32.7% | 31.0% | 2.1% | −1.0% |
| Over 1 million | 11,177 | 30.8% | 30.9% | 1.5% | −0.6% |
Under 10,000 listeners, more than half of artists were down at least 10% six months later. Not flat. Down. The doubling stories you see on Instagram are real, they're just 7 to 9% of that tier. Above 100,000 the picture flips into a coin toss, a third up, a third down, the median hovering at zero.
What I read in that shape is the release cycle. A small artist's monthly listeners are mostly the echo of their last single, and echoes fade. A big artist has a catalog, and a catalog holds. The number that decays fastest is the one everyone screenshots.
A Year Later
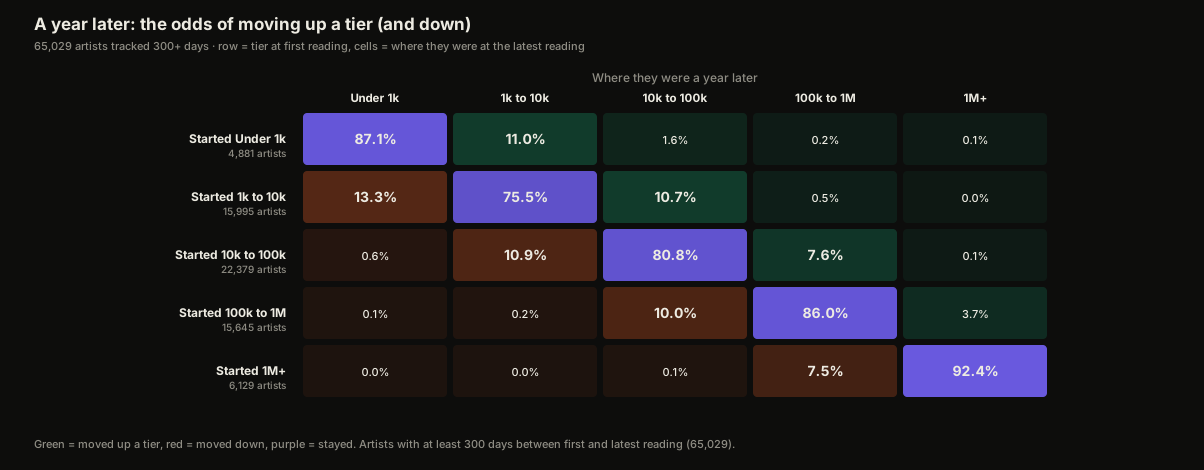
Widen the window to artists with 300 or more days between their first and latest reading, 65,029 of them, and ask a cleaner question: did they change tier at all?
| Started at | Moved up a tier | Moved down a tier | Stayed |
|---|---|---|---|
| Under 1,000 | 12.9% | n/a | 87.1% |
| 1,000 to 10,000 | 11.2% | 13.3% | 75.5% |
| 10,000 to 100,000 | 7.7% | 11.5% | 80.8% |
| 100,000 to 1 million | 3.7% | 10.3% | 86.0% |
| Over 1 million | n/a | 7.6% | 92.4% |
Roughly one in nine artists under 10,000 listeners climbed a tier in a year. Roughly one in eight in the middle tiers slipped one. From 100,000 to a million, crossing into seven figures happened for 3.7%, and falling back under 100,000 happened for 10%. Going down was more common than going up at every rung where both were possible.
I don't say that to be grim. I say it because when an artist tells me they've been "stuck at 30k for a year," the data says holding 30k for a year is what 81% of that tier did, and it beat the 11.5% who fell.
Followers Per Listener
I've written before about why a song gets streams and no fans: divide followers by monthly listeners and you get the share of people who heard you and chose to hear you again. Here's that ratio across the whole database.
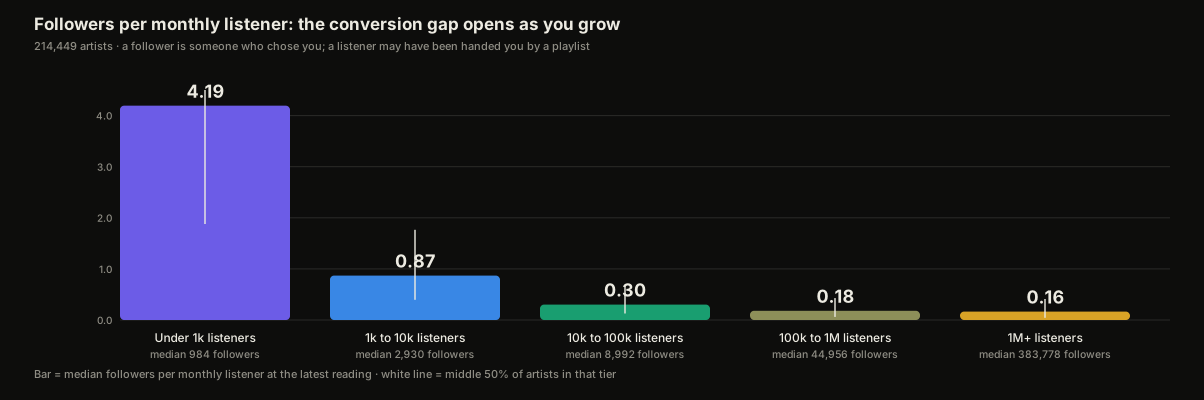
Among the 180,722 artists with at least 1,000 listeners, the median is 0.36 followers per listener. The bottom quarter is under 0.13. The top quarter is above 0.86. Only 2.4% of artists sit under 0.01.
And it falls as you grow. Under 1,000 listeners the median artist has more followers than listeners, 4.19 to one, which is what a loyal small audience looks like: the people who follow you are the people who play you. By 10,000 to 100,000 the median is 0.30. Past 100,000 it's 0.18, and over a million it's 0.16. The bigger the act, the larger the share of listeners who arrived through a playlist or the algorithm and never pressed follow.
That's the conversion gap I keep talking about in sessions, and it's the thing I think a record can actually fix. Playlists rent you listeners. The record is what converts them. In my data the follower count is the part of the audience you own, and the ratio is how well the music is closing.
Who Has a Team
The database also stores who's around the artist. Two fields move cleanly with size.
| Monthly listeners | Has a booking agent on file | Has a manager on file |
|---|---|---|
| Under 1,000 | 1.9% | 1.7% |
| 1,000 to 10,000 | 1.8% | 1.5% |
| 10,000 to 100,000 | 2.3% | 1.8% |
| 100,000 to 1 million | 4.1% | 2.2% |
| Over 1 million | 7.9% | 3.1% |
Even over a million monthly listeners, fewer than one in twelve artists in my database has a booking agent listed and fewer than one in thirty has a manager listed. Some of that is missing data, people don't always publish their team. But the direction is the point. The infrastructure shows up after the audience, not before it. Almost everyone below 100,000 is running the whole thing themselves.
What Chartmetric's Career Stages Mean in Listeners
If you've seen your artist labeled "developing" or "mid-level" on Chartmetric and wondered what it means, here is what those labels look like in my Spotify readings.
| Stage | Artists | 10th percentile | Median listeners | 90th percentile |
|---|---|---|---|---|
| Undiscovered | 42,923 | 61 | 1,242 | 6,082 |
| Developing | 127,339 | 1,002 | 19,621 | 150,641 |
| Mid-level | 19,846 | 28,037 | 354,760 | 951,235 |
| Mainstream | 21,895 | 10,015 | 885,558 | 3.7 million |
| Superstar | 1,696 | 283,472 | 10.2 million | 31 million |
| Legendary | 357 | 5.3 million | 11.0 million | 27 million |
The ranges overlap because the stages aren't a listener count, they weigh momentum and social reach too. A mainstream act at 10,000 listeners is usually a legacy name with a big following and a quiet catalog. "Developing" covers a huge span, from a thousand listeners to a hundred and fifty thousand, which is most of the working artists I meet.
What I Do With This
I'm a hands-off kind of a guy about other people's careers, so I'll keep this to what I've noticed in my own work.
The artists I've watched climb a tier didn't do it by finding more listeners. They did it by raising the ratio first. A record that converts at 0.8 followers per listener turns every playlist placement into audience you keep, and the next release opens to a bigger room. A record that converts at 0.1 has to buy the same crowd twice.
So when I'm listening to a mix now, the question in the back of my head isn't "is this loud enough" or "is this bright enough." It's whether the person who lands on it from a playlist is going to want it again tomorrow. That's a production question, and it's the one I'd rather answer than the screenshot one.
If you want to see where a specific track sits, our Sonic Analyzer scans it against the artists in its tier and genre who are converting, using the same database these numbers come from. And the two companion studies, average loudness by genre and tonal balance by genre, cover what those converting records measure like.
Method
214,451 artists with at least one Spotify monthly-listener reading, latest reading per artist as of September 8, 2026; 143,000 of them refreshed since June 2026. Readings are collected from Chartmetric into the Freshly Baked Studios artist database, 2,561,951 rows from January 2025 to September 2026. The six-month view uses each artist's latest reading and the most recent earlier reading 150 to 240 days before it (mean gap 170 days). The one-year view uses each artist's first and latest readings where they are at least 300 days apart. Follower ratios use the same latest reading. The database includes artists that appear on Chartmetric with a public contact route, so it under-represents artists with no footprint at all. Nothing here is survey data.

Multi-platinum producer & engineer — 19 Billboard Top 20 albums, 3.3B+ streams. Every project at Freshly Baked Studios is mixed and mastered by him personally.
Meet Alexander →Ready to Make Something Better?
Get a custom quote in 90 seconds — or book a free 30-min consultation.
19 Billboard Top 20 albums · 3.3B+ streams · Apple Digital Masters certified