By Alexander Almgren
Tonal Balance by Genre: What 319,496 Measured Tracks Actually Show
We measured the frequency balance of 319,496 tracks, and the biggest surprise is what doesn't change: bass. The 60-250Hz band holds a 13-16% share of spectral energy in almost every genre we classified. What actually separates a rock mix from an EDM mix from a folk mix is the top end, energy above 4kHz runs from 11% of the spectrum (ambient) to 37% (dance and house), and median brightness spans a full ladder from 1,222 Hz to 3,291 Hz. Not opinions, not forum folklore: measured audio, analyzed through the same pipeline that powers our Sonic Analyzer, from a 319,000-track database.
This is the frequency-domain companion to our loudness study of the same corpus. That one answered "how loud does my genre actually master." This one answers the question I get even more often in sessions: "what is a normal tonal balance for my genre, and what does a record that breaks out sound like against that normal?"
I've mixed and mastered records for 20 years, 19 Billboard Top 20 albums, and tonal balance is where I watch artists guess the hardest. Everyone has a reference track and an opinion about "modern bright" or "warm and analog." Almost nobody has numbers. So here are the numbers.
The Data: Tonal Balance by Genre
For each track the analyzer measures how the spectral energy splits across seven bands, plus brightness.
What "brightness" actually means here. The obvious question is how a whole song gets a single frequency number when a song is playing every frequency at once. The answer: it's an average.
Take every frequency in the track, weight each one by how much energy is sitting there, and average them. That gives you one number in Hz. It's the same idea as the average age of a room full of people. Nobody in the room is literally 34, but if the average is 34 you know it's not a nursery and it's not a retirement home. Brightness tells you the same kind of thing about where a record's energy lives.
To anchor the numbers musically: the highest note on a piano is about 4,200 Hz, and the note two octaves above middle C is about 1,050 Hz. So an ambient record averaging 1,222 Hz has its energy centred down around that middle-of-the-piano region, which is exactly what pads and low strings and space give you. A dance record averaging 3,291 Hz has its energy centred up near the very top of the piano, because hats, synth sizzle, and air are pulling the average upward.
Three things this is NOT: it isn't the highest frequency in the song, it isn't a treble knob, and it isn't a quality score. Two records can extend to exactly the same top frequency and still measure completely differently, because what moves the average is how much energy is up there, not whether anything is up there at all.
What moves it in practice: add cymbals, air, and presence and the average climbs. Roll the top off, or let the bass and mids dominate, and it falls. So when your track reads 2,200 and your genre's centre is 2,900, that's telling you your record's weight is sitting lower than the lane you're competing in.
Here are the 20 genre lanes, ranked brightest to darkest:
| Genre | Tracks | Brightness (Hz) | Middle 50% | Bass share | Mid share | 4kHz+ share |
|---|---|---|---|---|---|---|
| Dance / EDM | 19,045 | 3,291 | 2,609-4,064 | 13% | 22% | 37% |
| Metal | 7,468 | 3,182 | 2,822-3,532 | 13% | 26% | 31% |
| House | 13,145 | 3,102 | 2,440-3,695 | 16% | 20% | 37% |
| Punk / Emo | 8,702 | 3,077 | 2,623-3,495 | 13% | 26% | 31% |
| Electronic | 11,068 | 3,007 | 2,226-3,753 | 15% | 22% | 35% |
| Reggae / Dancehall | 3,248 | 2,987 | 2,522-3,463 | 14% | 25% | 32% |
| Hip-Hop / Rap | 44,506 | 2,978 | 2,475-3,500 | 14% | 23% | 34% |
| Rock | 14,222 | 2,947 | 2,454-3,384 | 13% | 27% | 29% |
| Latin | 25,318 | 2,921 | 2,407-3,429 | 14% | 26% | 31% |
| Afrobeats | 2,156 | 2,893 | 2,400-3,446 | 15% | 23% | 32% |
| Christian / Gospel | 5,691 | 2,782 | 2,259-3,269 | 13% | 28% | 28% |
| Pop | 45,173 | 2,770 | 2,199-3,342 | 14% | 27% | 29% |
| Alternative | 8,661 | 2,724 | 2,179-3,223 | 14% | 27% | 28% |
| R&B / Soul | 9,899 | 2,709 | 2,194-3,257 | 15% | 25% | 30% |
| Country / Folk | 11,423 | 2,657 | 2,128-3,185 | 14% | 29% | 27% |
| Indie | 11,349 | 2,537 | 2,003-3,055 | 15% | 28% | 27% |
| Singer/Songwriter | 3,166 | 2,268 | 1,767-2,755 | 15% | 30% | 24% |
| Jazz | 3,286 | 2,203 | 1,624-2,731 | 17% | 29% | 21% |
| Instrumental / Score | 7,919 | 1,648 | 905-2,544 | 16% | 30% | 15% |
| Ambient | 5,448 | 1,222 | 686-2,046 | 21% | 27% | 11% |
Coverage: the 20 lanes above account for 260,893 tracks, classified by the analyzer's own genre engine, the same lane definitions as the loudness study. The remaining 58,603 tracks carry tags too niche or mixed to name honestly, or no genre at all; they still feed the overall numbers (overall median brightness 2,856 Hz, middle half 2,252-3,423). Bass share = 60-250Hz; mid share = 500Hz-2kHz; 4kHz+ share = presence (4-8k) plus air (above 8k). Shares are medians of each band's fraction of total spectral energy.
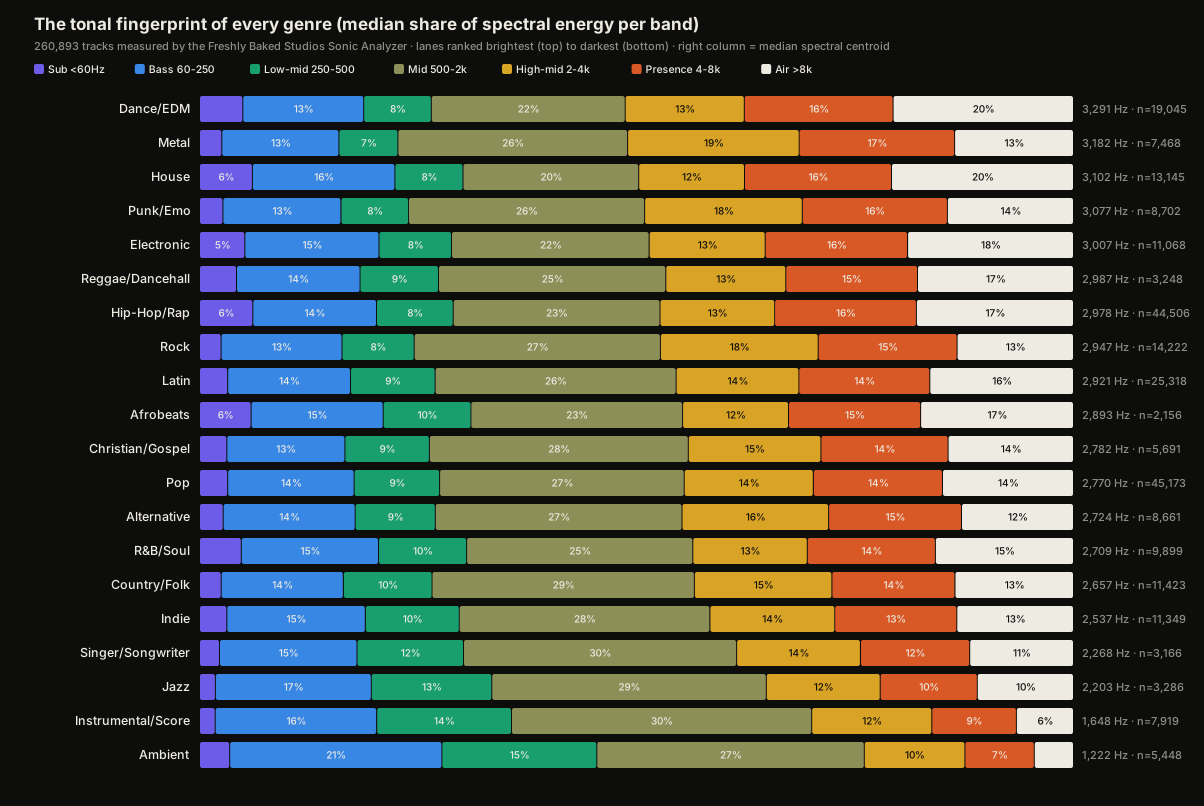
Method, briefly: every track was analyzed from actual audio by the same pipeline that powers the Sonic Analyzer, and these measurements live in the same table the analyzer benchmarks your scan against, so when you run a track through the scanner it is being compared against exactly these numbers. To be precise about provenance: they accumulated from our ongoing catalogue analysis over time rather than being scanned fresh for this study. Spectral energy is split into seven bands (sub <60Hz, bass 60-250, low-mid 250-500, mid 500-2k, high-mid 2-4k, presence 4-8k, air >8k), measured on the track's highest-energy sections, and brightness is the spectral centroid. Ns are in the table; this isn't a 40-song listicle sample.
The Three Findings That Matter
1. Bass is a constant. The top end is the genre. This is the one that rearranged my own mental model. The internet talks about tonal balance as if genres fight their wars in the low end, "hip-hop needs more bass," "folk should be warm." The data says the bass band is nearly a fixed cost: 13-16% of spectral energy in 19 of 20 lanes (ambient, at 21%, is the lone exception, music built out of low end because there's often nothing else in the arrangement). Meanwhile the share of energy above 4kHz more than triples across the same table, from 11% to 37%, and the air band alone (above 8kHz) runs from 4% of an ambient master to 20% of a dance master. Where a mix sits on the genre map is decided by presence and air, not by bass. If you're referencing against another genre's record, the thing you're accidentally importing is its top end.
2. The brightness ladder is the loudness ladder. Put this table next to the LUFS table and the ranking is nearly the same list twice: dance/EDM, metal, house, and punk sit at the top of both; jazz, instrumental/score, and ambient sit at the bottom of both. Loud and bright travel together, partly physics (hard limiting adds harmonics and pushes energy upward), partly intent (the genres that want maximum playlist impact want it in both dimensions). The practical read: if your genre masters loud, it also masters bright, and a dark loud master or a bright quiet one reads as out-of-lane twice.
3. "Slower songs don't go as high" is true, but only at the slow extreme, and it's mostly a genre effect, not a tempo effect. We went in to test exactly this hypothesis. Median brightness does climb with tempo at the bottom of the range: about 2,386 Hz in the 60-70 BPM bin, rising to about 2,957 Hz at 120-130 BPM. But from 100 BPM to 200 BPM the curve is essentially flat, and the overall tempo-brightness rank correlation is a tiny +0.07. The sharper test is within-genre: inside any single lane the correlation nearly disappears (from −0.03 in Afrobeats to at most +0.15 in instrumental/score, nothing there you could mix by). Slow tracks measure dark because the slow lanes are the dark lanes: ambient, scores, jazz, singer/songwriter. Drop a ballad into a pop arrangement with modern production and its top end looks like pop, not like ambient. Tempo isn't rolling off anyone's highs; arrangement density and production intent are.
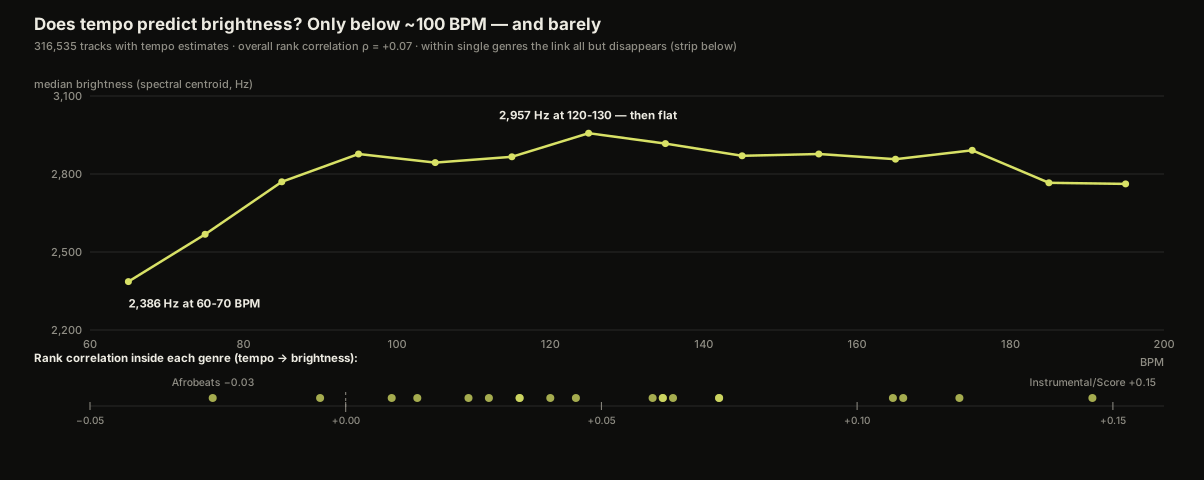
One honesty note on tempo: automatic tempo detection sometimes halves or doubles fast tracks (a 170 BPM drum-and-bass record can read as 85). That kind of octave error blurs the tempo axis, so treat the BPM curve as directional. It doesn't rescue the hypothesis though, an octave error moves a track along the tempo axis but doesn't change its measured brightness, and the within-genre correlations stay near zero regardless.
The Re-Brightening: The Top End Is Coming Back
We have release dates, so we also asked whether "the modern sound" is actually drifting, is there an emerging tonal balance?
There is, and it's recent. Median brightness of new releases slid gently for eight years, 2,921 Hz for 2016 releases down to 2,781 Hz for 2024 releases, and then reversed hard: 2,866 for 2025 releases and 2,916 for 2026, the brightest cohort in a decade. The move is concentrated where you'd least expect a fad to hide: the air band. The share of energy above 8kHz held between 14.5% and 15.2% for nine straight years, then jumped to 15.6% (2025) and 16.1% (2026).
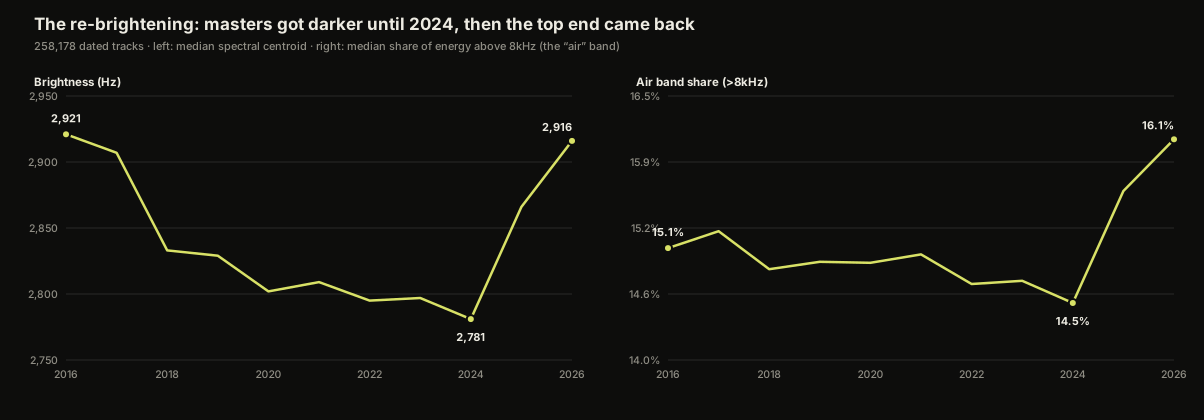
And it isn't a genre-mix illusion: the same 2021-to-2026 rise shows up inside the individual lanes, hip-hop's median brightness is up 162 Hz since 2021, house and metal are each up 175, R&B up 155, pop up 123. (The counter-current is real too: ambient, scores, and singer/songwriter keep getting darker. The lanes are polarizing, song-forward genres are adding air while atmosphere-forward genres are shedding it.) Readers of the loudness study will notice the timing: the re-brightening lines up with the loudness relapse we documented there, since roughly 2022, masters have been getting louder and brighter at the same time. Same war, second front.
A caveat I owe you: recent release years contribute far more tracks to our database than older ones, and the artists being scanned today aren't a perfectly matched sample of the artists from 2016. The within-lane consistency of the rise makes me believe it, but I'd call it a strong signal, not a settled fact.
What Breakout Records Do Differently
This is the question that started the whole study for me: fine, that's the normal tonal balance, but what does the record that actually breaks an artist sound like against that normal?
First, the definition, because a claim like this is only as honest as its yardstick. We have Spotify monthly-listener history (snapshots roughly every two weeks) for the artists in our database. For every track released between August 2025 and April 2026 where we had a listener count from before the release (at least 500 monthly listeners, measured within 120 days prior) and counts from the 90 days after, we computed a simple growth number: post-release peak divided by pre-release baseline. That gave us 51,868 release-anchored observations. A breakout is a release where the artist at least doubled their monthly listeners within 90 days, 3,863 tracks, about 7% of the sample. One caveat I want in plain sight: this attributes artist-level growth to the track released in the window, and growth can come from a playlist add, a tour, a TikTok moment, or a different song entirely. It's a real-outcomes yardstick, not a causal proof.
With that yardstick, here's what the breakouts measure:
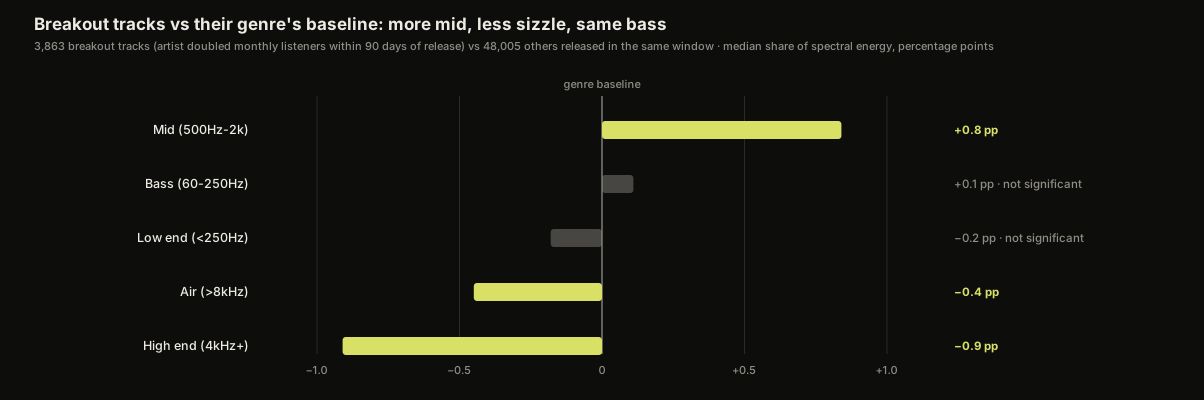
Breakout records are more mid-forward and less bright than their genre's baseline. The 500Hz-2kHz band, where vocal body, snare crack, and guitar/keys fundamentals live, carries +0.8 percentage points more energy in breakouts than in the rest of the field (p < 0.001 on a permutation test). The energy above 4kHz runs −0.9 points lighter, the air band alone −0.4 points lighter (both significant), and the spectral centroid reads about 40 Hz darker (directionally consistent, though that one sits just outside our significance bar). Bass, meanwhile, doesn't move: the low end is statistically identical between breakouts and everyone else, which fits the rest of this study, the low end is a solved, standardized problem, and nobody is breaking out by having more of it.
And breakout records are not tonal outliers. We also measured how far each track sits from its own genre's tonal center, and the breakouts are no farther out than anyone else, if anything a hair closer in. So there's no evidence in this data for the romantic version of the "signature sound" story, where the record that blows up sounds unlike its genre. The record that blows up sounds like its genre, with the balance tipped a point toward the mids, toward the vocal, and a point away from the sizzle.
That's the whole-field picture. Lane by lane it gets more specific, and R&B was the one that stopped me: the R&B records that broke out carried more 250 to 500 Hz, not less, the band most mixing advice tells you to cut. That one gets its own post.
Now put that next to the re-brightening. The market as a whole has been adding air since 2024, and the records that actually convert listeners into fans lean the other way, toward mids and away from the top. I'd read it this way: brightness is cheap now (every stock chain has an exciter and a maximizer at the end of it), and when everyone buys the same brightness, it stops being a differentiator and starts being a tax on the band where the song actually lives. The mix move that survives the fashion cycle is the unfashionable one: make the middle of the record, the singer, carry more of the energy. It's the same conclusion the loudness data pointed to from a different direction: the winners aren't at the extremes of any of these measurements. They're in-band, with the balance spent on the song.
The pop lane, cut on its own, adds a rhythm dimension to this: the pop records that broke out hit softer and had fewer events per second, and a softer beat with an airy, detailed top more than doubled the breakout rate. That study is here.
We went back to this with two more measurements, the analyzer's genre-positioning and tonal-deviation scores, across all 51,868 releases, and the answer held: the records that broke out sat closer to their genre, not further.
What "Mid-Forward" Actually Means at the Desk
Statistics are one thing. Here's what this looks like in practice, because "put more energy in the mids" is not a plugin setting.
That 500Hz to 2kHz band is where all the interesting meat is. The weight and the energy of the drums, the fatness of the bass, where the vocal actually sits, the whole snare sound. It's where the music is happening.
So when I mix, I'm moving the midrange around inside that range constantly, and I'm routing the music into mix buses so the compressors envelop and swell in the midrange without it ever feeling overbearing or heavy. When you push into that band, what you're really doing is flattening the frequencies around it to meet the midrange energy, so it stays locked. Then you feed it, carefully, so it never gets out of control.
If you want the physical version of this, it's practically the range of an Avantone MixCube, the little single-driver mono box sitting in most professional rooms (and the Auratone before it, which is why old records translate so well). Engineers have been checking mixes on midrange-only speakers for fifty years for exactly this reason. If the record sounds right on those, it will probably hold up everywhere else. This data is essentially that studio habit, measured across 300,000 tracks.
And the reason it pays off is translation. That 500 to 2k range is the one stretch of the spectrum that every playback system reproduces. Sub-bass is the first thing a phone speaker gives up. Air is the first thing a cheap earbud smears. The mids survive all of it. That's why a mid-forward record holds together on a massive club system, on a hi-fi at home, and through an iPhone speaker, and I suspect it's a large part of why the breakout records measure the way they do. More people are hearing those records the way they were actually made.
What To Do With This
Don't mix toward another genre's fingerprint by accident. Pull up the table, find your lane, and notice that the argument you're having with your low end is probably not the argument that matters, your bass share is going to land within a point or two of everyone else's, while your presence and air decisions place you on the map. A master that lands inside its lane's middle-50% brightness band reads as native to the playlist; a master 800 Hz out of band reads as either a demo or a different genre. If you want to know where your track actually sits, your band-by-band balance against your genre's converting cohort specifically, the same measurements this study is built from, run it through the Sonic Analyzer; the scan is free and takes about a minute (here's a full 19-minute walkthrough of what a scan shows you). And if the scan says the top end needs real work, here's what mixing and mastering cost, honestly itemized, or get a number calibrated to where you are as an artist from the rate calculator.

Multi-platinum producer & engineer — 19 Billboard Top 20 albums, 3.3B+ streams. Every project at Freshly Baked Studios is mixed and mastered by him personally.
Meet Alexander →Ready to Make Something Better?
Get a custom quote in 90 seconds — or book a free 30-min consultation.
19 Billboard Top 20 albums · 3.3B+ streams · Apple Digital Masters certified