By Alexander Almgren
R&B Mixing Data: The Records That Broke Out Had More Low-Mid, Not Less
We measured 1,936 R&B releases and compared the 182 whose artist at least doubled their Spotify monthly listeners within 90 days against the 1,754 that didn't. The breakouts carried more energy between 250 and 500 Hz, 10.4% of the spectrum against 9.3% (p = 0.008). It was the only one of the seven frequency bands that separated the two groups inside the R&B lane. And when low-mid in the top third of the lane lined up with a controlled dynamic range and a clean harmonic picture, the breakout rate went from 9.4% to 18.3%. Measured audio, not forum folklore, from the same pipeline that runs our Sonic Analyzer.
This one came out of the numbers sideways. I was going back through our breakout data lane by lane, the same dataset behind the tonal balance study and the loudness study, looking for anything that repeated. Most lanes gave me one or two signals and a lot of noise. R&B gave me the same signal four different ways. Every combination of measurements that held up in that lane had the same ingredient in it, and it was the band I was taught to cut.
I've mixed and mastered records for 20 years, and this octave on a vocal is one I have opinions about. So I want to be careful about what this data does and does not say, and I want to say it plainly.
What 250 to 500 Hz Actually Is
Before the numbers, the band itself, because "low-mid" is one of those words that means something different depending on who's at the desk.
It's the body of a voice. Not the tone, not the air, the part you feel in your chest when someone sings close to the mic. It's the warmth in a Rhodes, the left hand on a piano, the wood in an acoustic guitar. It's where the upper harmonics of the bass live, the part of the bass note you can still hear on a laptop after the fundamental is gone. In an R&B record that whole list is the record. The vocal, the chords, the bass talking to each other. Most of what makes a soul record feel like a room instead of a screen is sitting in that octave.
The way I'd say it at the desk is simpler. 250 to 500 is the sweet spot of the midrange. For a song to work, the energy has to happen there. It's what a small speaker gets to reproduce, and small speakers are most speakers now. If your monitors can handle what's below it, that's where your low-end energy comes from, and it's real when it's there. But it's not where the body and the magic of the song live. That's in this octave, which is why there's such a focus on it in the first place.
It is also where a mix goes wrong first. Stack a vocal, a pad, a guitar and a bass and they all bring some 300 Hz with them, and the sum turns to mud. So the standard reflex is to notch it. Cut a few dB around 250 to 400 on nearly everything, clean it up, get the clarity back. Every mixing tutorial I have ever seen says some version of this. It's not wrong. It's just not the whole picture, and this data is the other half of the picture.
The Data
The R&B lane here is 1,936 releases from August 2025 through April 2026 where we had the artist's Spotify listener history on both sides of the release date. A breakout means the artist at least doubled their monthly listeners within 90 days, against a pre-release baseline of at least 500. That's 182 records, 9.4% of the lane.
For every track the analyzer measures how the spectral energy splits across seven bands. Here is the low-mid band, breakouts against everyone else:
| Breakouts (182) | Rest (1,754) | Difference | |
|---|---|---|---|
| Low-mid share, 250 to 500 Hz | 10.4% | 9.3% | +1.1 points (p = 0.008) |
One point of spectral energy does not sound like much. So here is the same thing as a rate. Split the lane into thirds by how much low-mid each record carries:
| Low-mid share | Records | Broke out |
|---|---|---|
| Bottom third (8.2% or less) | 646 | 8.7% |
| Middle third | 645 | 7.4% |
| Top third (over 10.8%) | 645 | 12.1% |
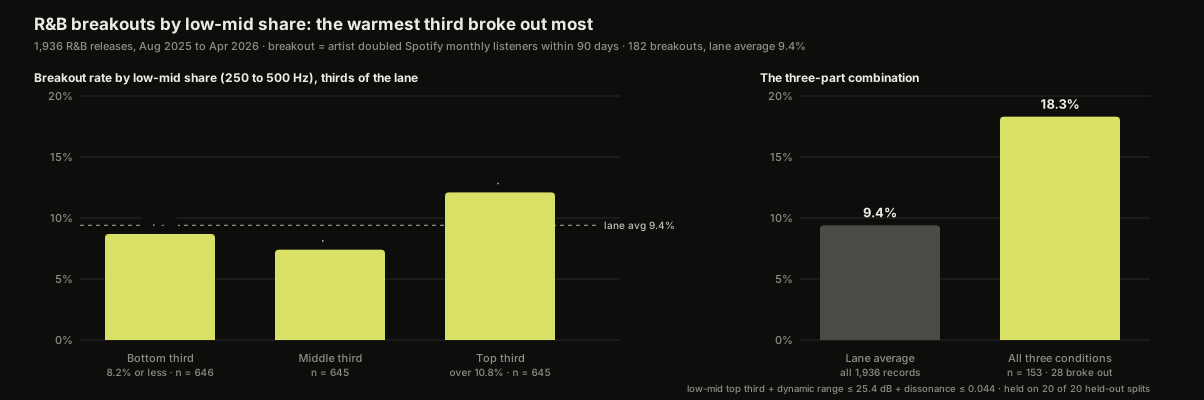
The top third breaks out at about 1.3 times the rate of the bottom third. On its own that's a real but modest edge.
What makes it worth writing about is what the other six bands did in this lane, which is nothing. Sub, bass, mid, high-mid, presence, air: none of them separated the breakouts from the rest at any level I'd put in print (the closest was air, at p = 0.18). Inside R&B, low-mid was the one band that moved.
It's Not That R&B Is a Low-Mid Genre
My first thought was that soul music just lives there and the number was telling me something about the genre. It isn't. The R&B lane's median low-mid share is 9.4%. Pop's is 9.5%. Folk and country sit at 9.7%. Rock is 8.6%, hip-hop 8.3%, electronic 8.0%. R&B is right in the middle of the pack.
So the genre isn't unusually warm. The records inside the genre that grew were warmer than their neighbours. That's a different and more interesting thing.
The Combination
A single band moving 1.3 times is a lean. What I actually went looking for was whether certain measurements land together on the records that break, because that's how it goes at my desk. I'm not setting one knob, I'm setting five.
I tested combinations of two and three conditions inside the lane, each condition being "top third" or "bottom third" of the lane on one measurement. Then, because searching thousands of combinations turns up winners whether or not they're real, every candidate was re-fitted and re-scored on twenty random halves of the data it had never seen. Only combinations that held on those held-out halves are reported.
The strongest one in R&B:
- Low-mid in the top third (over 10.8% of spectral energy)
- Dynamic range in the bottom third (25.4 dB or less; the lane median is 26.3), meaning a more controlled master
- Low measured dissonance (0.044 or less; lane median 0.056), a cleaner harmonic picture
153 records met all three. 28 of them broke out. That's 18.3% against the lane's 9.4%, roughly double, and it held across every one of the twenty held-out splits, with a median lift of 2.0 times.
Three other combinations also survived the same test in this lane, at 1.6 to 1.7 times. All four of them had the low-mid condition in them. That's the part that made me stop. It wasn't one lucky pairing. Whatever else the winning R&B records had, they had this.
The Catches
I'd rather you hear these from me than work them out later.
Breakout is measured at the artist, not the track. If an artist doubled their listeners in the 90 days after a release, that release gets the credit. The growth can come from a playlist add, a tour, a sync, a moment on a short-form platform, or an entirely different song. It's a real-outcomes yardstick, not proof of cause.
Size and money were checked, and they don't explain it. Doubling your audience is far easier from 800 listeners than from 300,000, and signed artists double more often than unsigned ones at the same size. Both are true in this data and both are large. So the combination above was re-scored only among R&B artists with more than 10,000 listeners (it held, at 2.0 times, p = 0.011) and only among unsigned R&B artists (it held, at 1.6 times). The low-mid lean on its own also held in both groups. This is not a story about who could afford a better master.
The genre tags cover about 45% of tracks. We classify by the track-level tags that come down with each release, mapped through our genre taxonomy, and tags that don't resolve fall out rather than getting guessed. 1,936 is what's left in the R&B lane after that. It's enough to test. It's not enormous. 182 breakouts and a combination cell of 153 records are numbers I'd call solid, not bulletproof.
Correlation. Nothing here says that adding 300 Hz to a record makes it grow. It says the R&B records that grew had more of it. Those are different sentences and I'm only standing behind the second one.
What This Looks Like at the Desk
I'm not going to turn a dataset into a preset, and I'm not going to pretend I mix a soul vocal off a chart. One vocal depends on the context of the song and the depth of the voice. Usually, if it sounds right, it is right.
What I can tell you is what I've been doing more and more lately, and it lines up with these numbers better than I expected. I don't notch the low-mids on a vocal. I use my 632 Hz trick on it: roll everything off below 632 for a moment, listen for where the focus of the vocal's low end actually sits, then take the roll-off away and shape that region with a low shelf instead of a notch. A shelf sounds more natural to me than a notch, and it sounds more natural than a complete roll-off. You keep the body of the singer and you decide how much of it, rather than carving a hole where the body used to be.
Because on a soul vocal, what's living in that octave is usually the singer. The chest, the weight, the thing that makes it a person and not a sound. A notch trades some of that for clarity. A shelf lets you keep it. The data says the records that grew kept more of it, and that's the part that lines up.
The other thing this band does is travel. Sub-bass is the first thing a phone gives up. Air is the first thing a cheap earbud smears. But 250 to 500 comes through on almost everything, a laptop, a car, a phone on a kitchen counter. A vocal with body reads as a vocal on every one of those. A vocal that's been scooped for clarity on big monitors can arrive on a phone as a thin voice over a beat. I don't know that this is why the breakout records measure the way they do. I suspect it's part of it. More people are hearing the warmer records the way they were made.
And the combination is a reminder that none of this is a single move. The records that doubled weren't just warmer, they were warmer with a controlled master and a clean harmonic picture underneath. Warmth on top of a muddy arrangement is just more mud. Warmth on top of a tidy one is a body in the room.
In this lane, in this data, the band I was taught to cut is the band the growing records had more of. I'm going to sit with that for a while.
What To Do With This
If you make R&B or soul, pull your mix up and look at 250 to 500 before you touch it. Not to boost it. To find out what you'd be cutting. If it's the singer, that's your call to make with your eyes open. If you want to know where your record actually sits, band by band, against the R&B records that converted, run it through the Sonic Analyzer; the scan is free and takes about a minute, and it measures the same seven bands this study is built from. And if the scan says the low end and the low-mid are fighting each other and you'd rather have a second pair of hands on it, here's what mixing and mastering cost, itemized honestly, or get a number calibrated to where you are from the rate calculator.

Multi-platinum producer & engineer — 19 Billboard Top 20 albums, 3.3B+ streams. Every project at Freshly Baked Studios is mixed and mastered by him personally.
Meet Alexander →Ready to Make Something Better?
Get a custom quote in 90 seconds — or book a free 30-min consultation.
19 Billboard Top 20 albums · 3.3B+ streams · Apple Digital Masters certified