By Alexander Almgren
Spotify Genre Statistics 2026: Which Genres Grow and Which Decay, Across 214,451 Artists
I published the artist statistics study this week, and the question I kept asking myself while writing it was the obvious one. Fine, more than half of small artists lost listeners over six months. But is that everyone, or does it depend on the genre?
So I cut the same database by genre, using the same genre system as our loudness study and our tonal balance study: every artist's Chartmetric tags mapped into genre lanes and, underneath those, subgenres. Same 214,451 artists, same readings taken between January 2025 and September 2026. An artist counts once in every lane and subgenre their tags map to, because nobody makes music in exactly one, and 187,363 of them map to at least one lane.
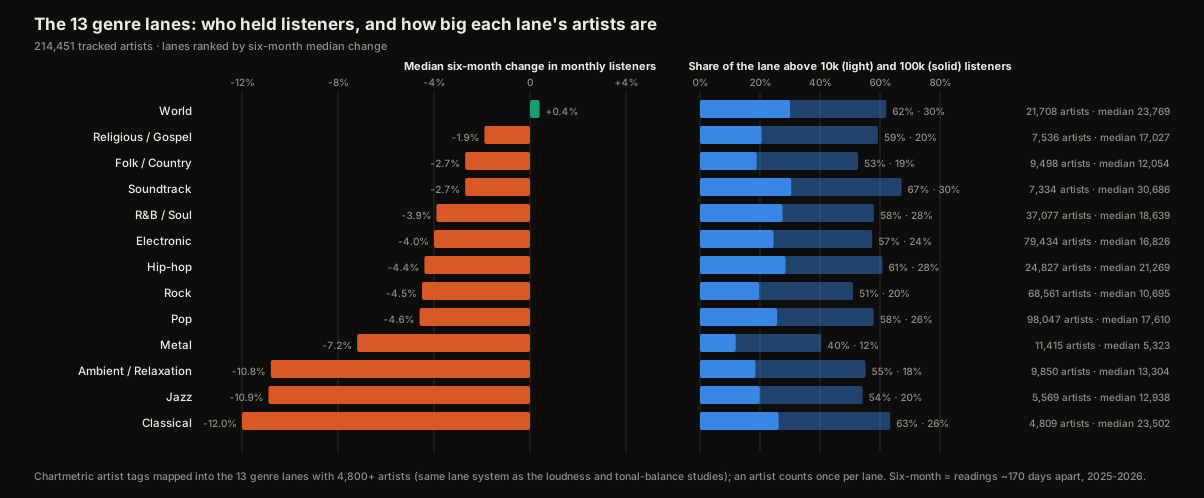
The short version: World music, Latin above all, held its audience. Regional rap grew. Every song-based lane lost 4 to 5% for the typical artist. And the quietest music, jazz, classical, orchestral and ambient, lost the most, 11 to 12%.
The 13 Genre Lanes
| Genre lane | Artists | Median listeners | Over 10k | Over 100k | Gained 10%+ | Lost 10%+ | Median 6-month change |
|---|---|---|---|---|---|---|---|
| World (Latin, Caribbean, African, Asian) | 21,708 | 23,769 | 62.1% | 30.0% | 37.7% | 34.4% | +0.4% |
| Religious / gospel | 7,536 | 17,027 | 59.3% | 20.5% | 32.6% | 37.9% | −1.9% |
| Folk / country | 9,498 | 12,054 | 52.7% | 18.9% | 32.8% | 39.6% | −2.7% |
| Soundtrack | 7,334 | 30,686 | 67.2% | 30.4% | 25.3% | 34.2% | −2.7% |
| R&B / soul | 37,077 | 18,639 | 58.0% | 27.5% | 31.0% | 39.9% | −3.9% |
| Electronic | 79,434 | 16,826 | 57.4% | 24.5% | 30.3% | 40.2% | −4.0% |
| Hip-hop | 24,827 | 21,269 | 60.8% | 28.5% | 28.0% | 39.5% | −4.4% |
| Rock | 68,561 | 10,695 | 51.0% | 19.7% | 28.1% | 40.3% | −4.5% |
| Pop | 98,047 | 17,610 | 57.9% | 25.7% | 28.9% | 40.9% | −4.6% |
| Metal | 11,415 | 5,323 | 40.4% | 11.9% | 22.0% | 44.4% | −7.2% |
| Ambient / relaxation | 9,850 | 13,304 | 55.2% | 18.5% | 22.3% | 51.0% | −10.8% |
| Jazz | 5,569 | 12,938 | 54.2% | 19.9% | 22.6% | 51.8% | −10.9% |
| Classical | 4,809 | 23,502 | 63.4% | 26.2% | 20.5% | 53.9% | −12.0% |
Two things jump out at me. The first is how low the guitar lanes sit. Rock and metal have the smallest share of artists above 10,000 listeners of any lane, and metal's median artist has 5,323, a quarter of hip-hop's. That's not a quality judgment, it's a shape. Guitar music has a long tail of working bands with a few thousand devoted listeners.
The second is the bottom of the table. Classical, jazz and ambient artists are not small, their medians sit in the middle of the pack, but more than half of them lost at least 10% of their listeners in six months. Something specific is happening to that music, and I'll get to it.
Six Months Later, by Subgenre
This is the cut I actually wanted. Underneath the lanes are 87 subgenres; these are the 31 with at least 500 artists we measured twice about 170 days apart.
| Subgenre | Artists | Median listeners | Over 10k | Gained 10%+ | Lost 10%+ | Doubled | Median 6-month change |
|---|---|---|---|---|---|---|---|
| Regional rap | 3,128 | 18,416 | 58.2% | 39.5% | 27.1% | 4.7% | +3.7% |
| Latin | 17,717 | 28,186 | 64.5% | 38.5% | 32.7% | 5.5% | +1.5% |
| Caribbean | 2,792 | 10,997 | 51.8% | 36.1% | 32.4% | 5.0% | +0.5% |
| Asian | 1,368 | 53,408 | 69.7% | 41.1% | 38.3% | 8.5% | +0.3% |
| African | 2,414 | 14,972 | 55.2% | 39.8% | 37.3% | 8.4% | +0.1% |
| Country | 6,999 | 12,855 | 53.4% | 35.2% | 37.8% | 5.4% | −1.3% |
| Worship | 6,381 | 17,971 | 60.4% | 33.3% | 37.1% | 3.8% | −1.3% |
| International pop | 11,976 | 17,058 | 57.9% | 31.9% | 36.2% | 5.0% | −1.9% |
| Retro R&B | 1,546 | 53,163 | 75.5% | 31.6% | 36.8% | 4.4% | −2.1% |
| Gospel | 1,388 | 16,700 | 58.5% | 31.8% | 39.0% | 3.6% | −2.6% |
| Film score | 7,099 | 29,008 | 66.4% | 25.3% | 34.5% | 2.6% | −3.0% |
| Dance / EDM | 59,205 | 16,072 | 56.7% | 31.9% | 39.2% | 5.2% | −3.2% |
| Hard rock | 29,096 | 11,326 | 51.7% | 29.4% | 38.7% | 4.3% | −3.7% |
| Classic R&B | 46,772 | 18,165 | 57.8% | 30.7% | 40.0% | 5.2% | −4.0% |
| Mainstream pop | 70,253 | 16,090 | 56.5% | 28.8% | 40.1% | 4.6% | −4.2% |
| Experimental electronic | 8,364 | 7,926 | 46.2% | 25.7% | 40.6% | 3.8% | −5.2% |
| Contemporary R&B | 3,516 | 13,856 | 54.3% | 27.3% | 42.3% | 5.2% | −5.4% |
| Emo | 6,323 | 15,534 | 57.0% | 21.5% | 40.3% | 2.7% | −5.5% |
| Pop rap | 1,804 | 35,587 | 69.5% | 25.2% | 40.9% | 3.4% | −5.6% |
| Trap / drill | 5,584 | 21,217 | 60.6% | 24.9% | 41.5% | 4.1% | −5.7% |
| Traditional folk | 3,483 | 9,056 | 48.0% | 26.0% | 44.7% | 3.3% | −6.7% |
| Indie pop | 35,929 | 15,857 | 56.7% | 25.1% | 44.3% | 3.8% | −6.8% |
| Heavy metal | 7,757 | 4,827 | 38.5% | 21.6% | 44.0% | 3.2% | −7.0% |
| Trap | 1,172 | 30,499 | 66.0% | 22.1% | 43.2% | 4.8% | −7.1% |
| Indie rock | 16,262 | 8,448 | 47.8% | 25.2% | 44.9% | 4.1% | −7.1% |
| Metalcore | 2,053 | 7,550 | 46.3% | 23.3% | 45.4% | 4.2% | −7.7% |
| Alternative rock | 18,732 | 3,977 | 35.7% | 25.0% | 46.5% | 5.2% | −7.7% |
| Ambient | 10,196 | 13,558 | 55.5% | 22.4% | 50.8% | 3.7% | −10.6% |
| Orchestral | 3,903 | 18,455 | 59.6% | 20.8% | 52.7% | 3.1% | −11.5% |
| Instrumental | 1,699 | 41,325 | 74.3% | 21.1% | 55.1% | 3.0% | −12.3% |
| Traditional jazz | 4,287 | 10,879 | 51.5% | 20.8% | 54.2% | 3.8% | −12.5% |
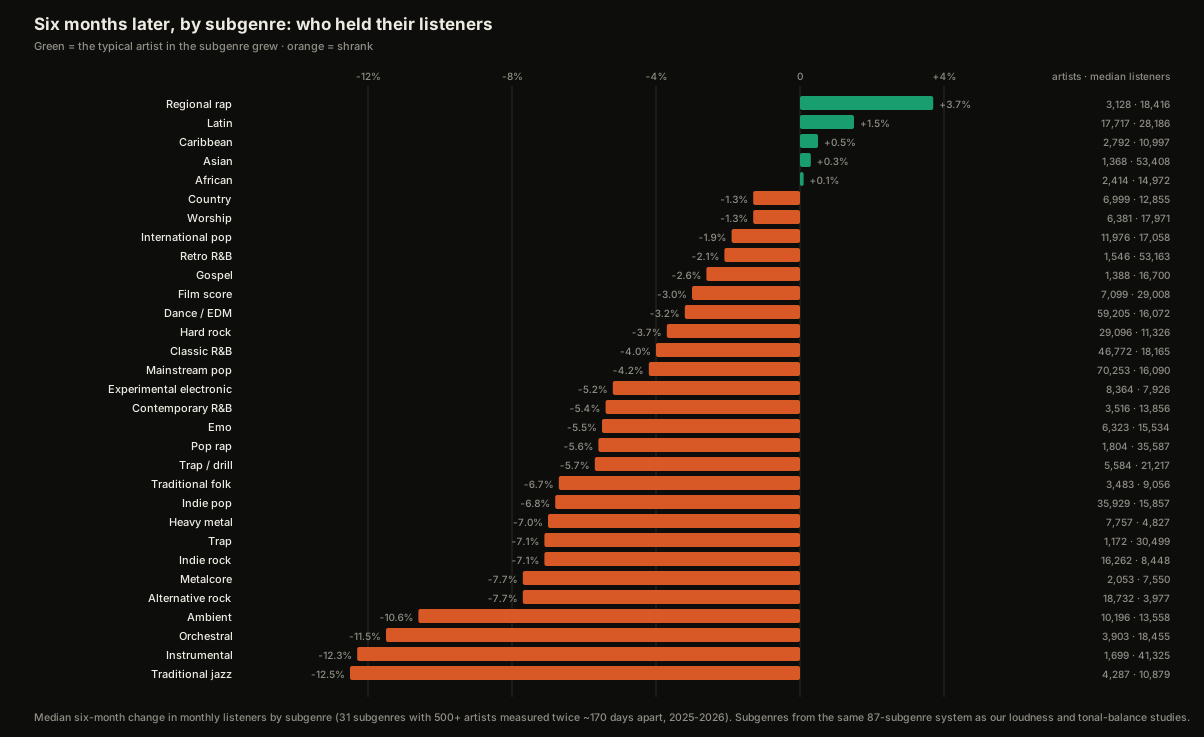
Five subgenres came out positive, and they're all music with a home outside the algorithm: regional rap, Latin, Caribbean, Asian and African. Country, worship, international pop and retro R&B held within two points of flat. Then the big commercial subgenres, dance, hard rock, classic R&B and mainstream pop, all down 3 to 4%. Then the indie and heavy subgenres, down 7 to 8%. And at the bottom, everything without a lead vocal: ambient, orchestral, instrumental, traditional jazz, down 11 to 13%, with more than half of their artists losing at least 10%.
One number in that table I keep coming back to: instrumental music has the highest median listeners of almost any subgenre, 41,325, and the worst retention. Those two facts are the same fact.
What I Think Is Going On
I want to be careful here, because a median change for a subgenre is not the subgenre's total streams. Latin can be exploding as a category while the typical Latin artist in my database still grows or shrinks on their own release cycle. What this table measures is the typical artist's experience, which is the thing that matters if you're the artist.
With that said, here's what I read in it, from what I see in sessions.
Dance and house artists release constantly. Singles, remixes, edits, a track a month for some of them. Each release refreshes the algorithm's interest, so their listener count never sits still long enough to decay. That's why dance/EDM sits near the top of the commercial subgenres. Song-based artists ship an album or an EP and then go quiet for a year while they write the next one, and monthly listeners is a number that measures the last ninety days. The −4% in the middle of that table is mostly the sound of people between records.
The instrumental subgenres are the opposite problem. Their listeners come overwhelmingly from playlists, sleep, focus, study, film-score moods, and a playlist audience is rented. When the curator rotates the tracks, the listeners leave with them, and the artist never had a follower relationship to fall back on. That's why the subgenres with the biggest medians, instrumental and orchestral, have the worst retention. I wrote about that mechanism in the artist statistics study: followers per listener is lowest exactly where playlists do the most work.
Regional rap, Latin, Caribbean, African and country are the interesting ones. All of them have a real scene underneath the streaming numbers, regional radio, a touring circuit, a language or a city that the audience identifies with. Asian and African music also had the highest share of artists who doubled, 8.5% and 8.4%, against 3% to 5% almost everywhere else. Whatever is feeding those subgenres, it isn't only the algorithm.
What Chartmetric's Raw Tags Say
The lanes above are built from Chartmetric's artist tags, and it's worth knowing how those tags work, because the raw tags tell a slightly different story if you read them without mapping. Chartmetric gives every artist one primary genre and a list of secondary tags, and the secondary list is where the regional labels live ("US pop," "European dance"). Counted raw, each artist under every tag they carry, the tags that held were Latin (+1.2%), house (−0.9%), Latin pop (−1.3%) and UK dance (−2.1%); the tags that fell hardest were ambient (−11.1%), instrumental and US easy listening (−9.4%), R&B (−9.1%) and UK rock (−8.9%). Same shape as the lanes.
Where the raw tags mislead is size. By primary tag only, indie's median listeners jump from 7,501 to 19,321 and soundtrack's from 27,862 to 44,650, because those tags as secondaries get stuck on a lot of small artists. And an artist whose primary tag is "US pop" carries 1.7 tags on average against 7 to 9 for most, and sits at a median of 4,236 listeners. That's not a fact about American pop. It's a metadata fact: thinly tagged artists are small artists, and Chartmetric fills in secondaries as an act grows. Mapping the tags into lanes and subgenres is how you stop that artifact from steering the table, which is why the lane and subgenre cuts above are the ones I'd quote.
What To Do With This
If you're in a song subgenre and your listeners dipped 4 to 7% since spring, the table says you're the median. It's not a verdict on the record. It's a release-cycle shape, and the fix is a release cycle: something out every eight to twelve weeks, even small, keeps the number alive between the records you actually care about.
If you're in dance, Latin or regional rap, your number is holding for you, and the question is whether the followers are keeping pace with it. Check the ratio.
If you're in ambient, orchestral, jazz or any instrumental lane, the number will keep leaking as long as playlists are the only door. The artists I see hold in those lanes have built the other door, a name, a face, a reason to press follow, and a master that sounds like a person rather than a preset. That's the part I can help with, and the analyzer will show you how your track measures against the artists in your subgenre who are converting.
Method
Same panel as the artist study: 214,451 artists with at least one Spotify monthly-listener reading, latest reading per artist as of September 8, 2026, collected from Chartmetric into the Freshly Baked Studios artist database (2,561,951 readings, January 2025 to September 2026). Genre assignment: each artist's Chartmetric tags (primary plus secondaries) are mapped through our genre taxonomy, 3,146 tag names into 20 genre lanes and 87 subgenres, the same system behind our loudness and tonal-balance studies; 187,363 artists map to at least one lane and 99,734 of those have a second reading 150 to 240 days before their latest one (mean gap 170 days). An artist counts once in every lane and subgenre they map to. The two R&B lanes in the taxonomy are merged, the two ambient subgenres are merged, and lanes under 4,800 artists (experimental, children's) and subgenres under 500 measured artists are not shown. Roughly 43% of raw tag occurrences, mostly obscure regional and language tags, don't map and are excluded. The database skews toward artists with a public contact route and under-represents the very bottom of Spotify. Nothing here is survey data.

Multi-platinum producer & engineer — 19 Billboard Top 20 albums, 3.3B+ streams. Every project at Freshly Baked Studios is mixed and mastered by him personally.
Meet Alexander →Ready to Make Something Better?
Get a custom quote in 90 seconds — or book a free 30-min consultation.
19 Billboard Top 20 albums · 3.3B+ streams · Apple Digital Masters certified